Sachiyo Aburatani
Computational Biology Research Center (CBRC), National Institute of Advanced Industrial Science and Technology (AIST), Tokyo, Japan
Correspondence: Sachiyo Aburatani, Computational Biology Research Center (CBRC), National Institute of Advanced Industrial Science and Technology (AIST), AIST Tokyo Waterfront BIO-IT Research Building, 2-4-7 Aomi, Koto-ku, Tokyo, 135-0064, Japan.
E-mail: s.aburatani@aist.go.jp
Key words: SOS response, network inference, stepwise graphical Gaussian model.
Acknowledgements: I thank Dr. Horimoto (CBRC, AIST) for permission to use the ASIAN web tool. SA was supported by a Management Expenses Grant from the National Institute of Advanced Industrial Science and Technology, Japan.
Conflict of interest: the authors report no conflicts of interest.
Received for publication: 28 May 2010.
Revision received: 13 October 2010.
Accepted for publication: 22 October 2010.
©Copyright S. Aburatani, 2010
Licensee PAGEPress, Italy
Journal of Nucleic Acids Investigation 2010; 1:e13
doi:10.4081/jnai.2010.e13
AbstractThe expression of many genes varies under different conditions. The relationships among genes can be identified from DNA microarray data. To better understand the SOS response, I developed a network model of whole LexA/RecA-dependent manner genes in two genotypes of Escherichia coli from expression data after ultraviolet (UV) irradiation. First, all LexA/RecA-dependent manner genes were estimated by a combination of the Mann-Whitney U test and hierarchical clustering. Second, the relationships between genes were inferred from a graphical Gaussian model (GGM) combined with hierarchical clustering.
|
Escherichia coli responds to severe conditions such as ultraviolet (UV) irradiation by initiating the SOS response, which repairs DNA lesions, restores replication, and prevents premature cell division.1,2 The SOS response controls gene transcription,3 and many genes are activated in sequence. Some of these DNA damage control genes are regulated by the LexA/RecA circuit mechanism.4,5 To date, 47 genes, directly regulated by LexA protein binding and activated by RecA concentration in a cell, have been identified by several different methods.6,7 Over 30 genes induced after UV irradiation act in a LexA/RecA-dependent manner, as determined from expression profiles, but it is not known if these genes act in a distinctive fashion from others activated by the SOS response.8 Furthermore, in the SOS response many genes are controlled in a LexA/RecA-dependent manner. Although the regulatory mechanisms of LexA protein binding have been described,4,5 the relationship between whole LexA/RecA-dependent manner genes remains unclear.
Previous studies have investigated gene relationships using expression profiles derived from microarray data, and several algorithms have been developed for inferring the gene network model.9,10,11 In our previous studies, I used two approaches to reconstruct the regulatory networks from the expression profiles of known LexA-regulated genes. Network inference by the graphical Gaussian model (GGM) determines the relationships of the genes associated with the known LexA-regulated genes.12 In the present study, I further developed this method by comparing the expression profile of whole LexA/RecA-dependent genes under different conditions by the Mann-Whitney U test13,14 and hierarchical clustering of expression data of empirically defined and undefined genes. Furthermore, I inferred the relationships of all LexA/RecA-dependent manner genes by performing a stepwise network inference approach based on GGM.
The fifteen expression profiles of 4289 genes derived by Courcelle et al.8 were downloaded from the GEO Database (http://www. ncbi.nlm.nih.gov/geo/). This provided information for the wild-type strain MG1655 (WT) and isogenic mutant lexA1 strains GPL17 and GPL18, with or without UV irradiation, producing four conditions.
Data were obtained from GEO series matrix files (GSE9-GPL17_series_matrix.txt and GSE9-GPL18_series_matrix.txt).
These files record the expression levels as log2-ratio of the raw expression signals. To compare different platform data, I utilized Z-scores transformed by log2-ratio.
Genes identified from the WT strain that showed a change in the expression level with UV treatment were considered to be LexA/RecA dependent. In contrast, genes in the lexA strain or WT without UV irradiation that did not show a change in expression were considered to be LexA/RecA independent.
First, the expression level for each condition of the different strains (WT and lexA1) and treatments (with or without UV) were compared by the Mann-Whitney U test. All statistical analyses were conducted using PASW Now IBM SPSS, statistics version 17 software]. Genes were regarded as LexA/RecA-dependent manner where their expression levels in WT with UV were significantly different from other conditions at P<0.01. After the LexA/RecA-dependent manner genes were identified, those with similar expression patterns to known LexA regulated genes were detected by hierarchical clustering.
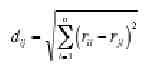
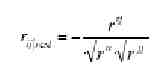
In this method, the Euclidian distance between the Pearson’s correlation coefficients of expression profiles for each gene pair represents the “distance” between genes. Clusters of similar genes are identified by delimiting a boundary between clusters. The distance between genes i and k is defined by:
[1]
|
|
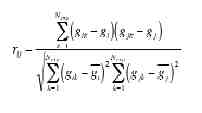
where n is the total number of genes, and rij is the Pearson correlation coefficient of the expression profiles between genes i and j at Nexp conditions:
[2]
 |
|
where gi is the arithmetic average of gik over Nexp conditions. A distance matrix between genes was calculated by the unweighted pair group arithmetic average (UPGMA) method to obtain clusters. The cluster boundaries were delimited using a stopping rule.15
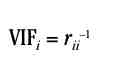
The number of clusters was estimated by the variance inflation factor (VIF). This measures the separation between clusters and identifies variables that are involved in the multicollinearity of the multiple regression analysis, and is defined by:
[3]
 |
|
where rii-1 is the ith diagonal element of the inverse of the correlation coefficient matrix (CCM) between explanatory variables.16 m VIFs are calculated from the CCM between m explanatory variables.16 m VIFs are calculated from the CCM between m explanatory variables.16
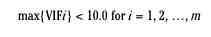
When the explanatory variables in equation 3 correspond to the gene profiles, the VIF expresses the degree of linear relationship between the profiles. The accepted cut-off value to diagnose multicollinearity is 10.0,16 and this threshold was used to delimit each cluster. The cut-off values were assessed from the condition:
[4]
 |
|
If the condition is satisfied, then no linear relationship exists in the m sets of profiles; if the condition is not satisfied then a linear relationship exists between profiles. Thus, the algorithm searches for the maximum number of clusters with no linear relationship.
Note that cluster boundaries derived by this method depend on the gene set and distance between clusters may change with different sets. The unweighted pair group method uses the arithmetic average (UPGMA) to separate clusters. Although the distance of each gene pair calculated at the first step is fixed by expression data, the distance among clusters may change according to the calculated gene set.
The average expression profiles for members of each cluster were calculated for input into GGM. The CCM for each cluster pair was calculated from their averaged expression profiles. In GGM, the network is inferred from a partial correlation coefficient matrix (PCCM) derived from the actual CCM15 between clusters.
A graph, G = (V, E) is drawn from the profile data17,18 to represent the relationship between M clusters, where V is a finite set of nodes, corresponding to the M clusters and E is a finite set of edges between the nodes. E consists of the edges between cluster pairs whose averaged expression levels are conditionally dependent, given the rest. Any pair of variables that are not connected in the graph G are conditionally independent. The conditional independence is estimated using the partial correlation coefficient, expressed by:
[5]
 |
|
where rij|rest is the partial correlation coefficient (PCC) between variables i and j, given the rest of the variables, and rij is the (i, j) element in the reverse of the CCM. Conditional independence between pairs of clusters was evaluated by a stepwise and iterative algorithm for covariance selection.19,20
Step 1. Prepare a complete graph of G(0) = (V, E). The nodes correspond to M clusters, and all of the nodes are connected. G(0) is called a full model. On the basis of the expression profile data, construct an initial CCM, C(0).
Step 2. Calculate the partial CCM P(τ) from the CCM C(τ). τ indicates the number of the iteration.
Step 3. Find an element that has the smallest absolute value among all of the non-zero elements of P(τ). Then, replace the element in P(τ) with zero.
Step 4. Reconstruct the CCM C(τ+1) from P(τ). In C(t+1), the element corresponding to the element set to zero in P(τ) is revised, while all of the other elements are left as the same as those in C(τ).
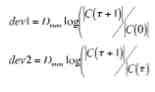
Step 5. Finalize the iteration by calculating deviance. Here, I used two types of deviance, dev1 and dev2:
[A]
 |
|
The two deviances follow an asymptotic χ2-distribution with n degree(s) of freedom and 1 degree of freedom, respectively. n is the number of elements that are set to zero until the (τ+1)th iteration. In our approach, n is equal to (τ+1). | C(τ) | indicates the determinant of C(τ). Dnum is the number of different conditions under which the expression levels of M clusters are measured.
Step 6. If the probability value corresponding to dev1 or dev2 is ≤0.05 then the C(τ+1) model is rejected and the iteration is stopped. Otherwise, the edge between a pair of clusters whose PCC is set to zero in P(τ) is omitted from G(τ) to generate G(τ+1) and τ is increased by 1; then, go back to Step 1.
The graph obtained using this procedure is undirected and represents a pair of conditionally independent clusters; that is, when the PCC for a cluster pair is equal to 0, the cluster pair is conditionally independent, indicating that there is no edge between the nodes corresponding to the clusters in the independence graph. In other words, the graph represents the genetic network of the M clusters under consideration.
All of the calculations for the clustering, estimation of cluster number and GGM were performed on Automatic System for Inferring A Network (ASIAN; http://eureka.cbrc.jp/asian/) web site.21,22
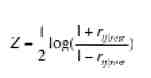
The initial networks produced by GGM are complicated forms with many edges. Because the magnitude of the PCC indicates the strength of the association between clusters, the intact network can be rearranged according to the PCC value, to interpret the association between clusters. The strength of the association can be assigned by a standard test for the partial correlation coefficient,23 Fisher's Z transformation of partial correlation coefficients. That is:
[6]
 |
|
Z has an approximate normal distribution, thus the graph can be rearranged to show significant associations by assessing the strength of PCC between clusters, via the t-test (P≤0.05).
The SOS response in E. coli is complicated. One means of clarifying the response is to use a stepwise application of GGM to identify the relationship between LexA/RecA-dependent manner genes. This produces a simplified network of clusters, which represents an overall relationship between genes. One problem with this, however, is that genes may not be equitably distributed between clusters and further interactions may be hidden within one large cluster. To break up large clusters, further levels of interaction can be ascertained by iteration of the model. Here, large clusters at each step were further divided by VIF estimation, to indicate networks within the cluster. Iterations were repeated until all clusters were multicollinear.
There were significant differences (P≤0.01) between expression levels in WT-UV treatment and other treatments in 709 genes. Of 47 previously identified LexA-regulated genes,6,7,24 33 were detected by a visual comparison.8 In our study, 39 known LexA-regulated genes were detected by Mann-Whitney U tests at P<0.01. Two out of six known LexA-regulated genes were difficult to detect from an expression change as there were no data for WT and UV treatments, and four other genes, which were not induced by UV irradiation, were undetected by Mann-Whitney U tests.
Hierarchical clustering was performed on the detected 709 genes and three clusters with 709 genes were delimited: 309 in cluster 1, 9 in cluster 2, and 391 in cluster 3. All known LexA-regulated genes were segregated in cluster 3. This implies that the expression of genes in cluster 3 is controlled by LexA/RecA.
Iteration of hierarchical clustering divided cluster 3 (391) genes into seven further clusters. The number of genes segregated by hierarchical clustering iteration is shown in Table 1 (steps 1-2) and Table 2 (steps 2-4). The gene names in each cluster are shown in the supplementary Table S1. In the tables, the number of known LexA-regulated genes in each cluster is indicated in parentheses. After the first iteration, cluster 5 (C1-5) was the largest and comprised 333 genes, including 32 known LexA-regulated genes. At the second step clustering, C1-5 was separated into five further clusters, including a larger cluster with 215 genes (C2-5). The 215 member genes in cluster 5 at the 2nd step (C2-5) divided into six clusters at the 3rd step. Finally, C3-5 divided into four clusters (Table 2). The other clusters were not sub-divided beyond the 3rd step, as they could not be classified easily owing to multicollinearity between sub-clusters. Almost all known LexA-regulated genes segregated into three clusters at the 2nd step, 12 in C2-1 and 17 in C2-5. At the 3rd step, 17 known LexA-regulated genes were divided into two clusters, 9 genes in C2-5-5 and 8 genes in C2-5-6 (Table 2).
Network of LexA/RecA genes
The initial network of inferred relationships (Figure 1A), derived from ASIAN, identified 17 of the 21 possible edges between seven clusters (approximately 80%) that included all estimated LexA/RecA-dependent genes. After the network was rearranged by extracting the relatively strong associations between the clusters, eight edges remained (Figure 1B).
The rearranged network (Figure 1B) identified six positive associations and two negative associations in a linear relationship with the central branch. The association between neighboring clusters was positive, while that between non-neighboring clusters was negative. This remarkable feature is similar to a network of LexA/RecA genes, induced as part of a circuit mechanism in the SOS response.3,4 As the linear relationships among the clusters represent sequential events of gene expression, the negative relationships may represent feedback regulation.
The association between genes in each 1st step cluster was examined in secondary and subsequent level clusters. Even though C1-2 and C1-4 divided into three and eight clusters at subsequent iterations of GGM, sub-clusters in C1-2 and C1-4 were independent and no hidden interactions were seen between genes in each sub-cluster. Figure 2 shows the inferred network among the clusters at the 2nd step. At the second step, one edge remained among the three clusters at C1-1, five edges remained among six clusters at C1-3, six edges remained among five clusters at C1-5, four edges remained among four clusters at C1-6, and three edges remained among five clusters at C1-6 (P≤0.05, t-test of PCC) (Figure 2).
Most networks were linear and featured positive relationships. Negative associations were observed between non-neighboring clusters (Figure 2B,C,D). This was similar to the pattern observed at the first level of iteration (Figure 1B).
A similar pattern emerged at the 3rd step (Figure 3) where adjacent clusters formed positive associations and negative associations formed between non-adjacent clusters. There were two edges among four clusters derived from C2-1, five edges among five clusters derived from C2-2, three edges among six clusters derived from C2-3, one edge among three clusters derived from C2-4, and five edges among five clusters derived from C2-5.
Although the edges in inferred networks have no direction, the difference between positive and negative associations was apparent in all networks. This specific feature appears in both whole (Figure 1) and partial (Figure 2 and 3) networks constructed with statistically estimated LexA/RecA-dependent manner genes. This implies that the network of LexA/RecA-dependent manner genes within the SOS response includes some form of feedback between genes.
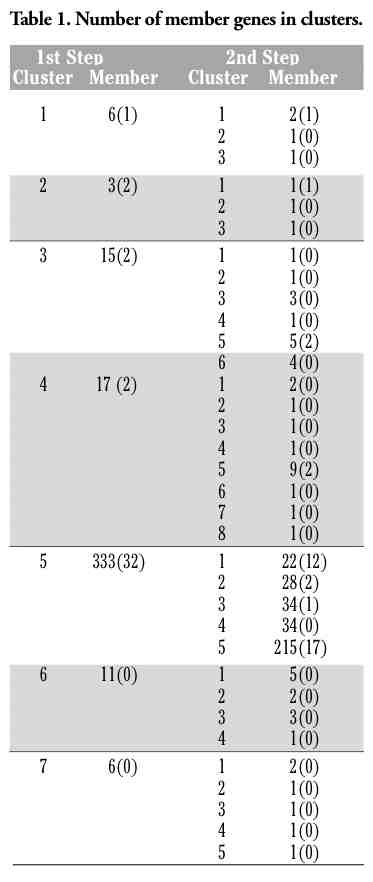 |
Table 1. Number of member genes in clusters. |
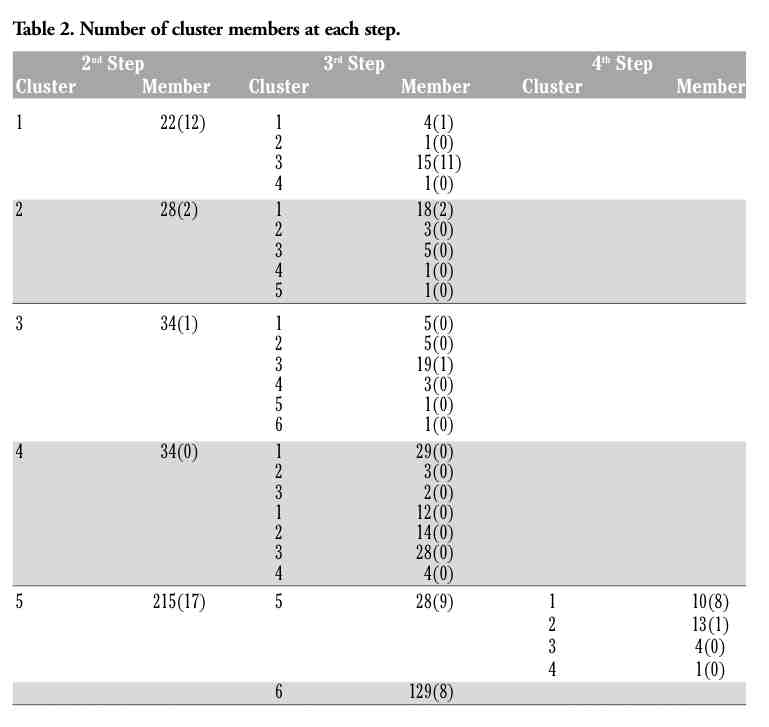 |
Table 2. Number of cluster members at each step. |
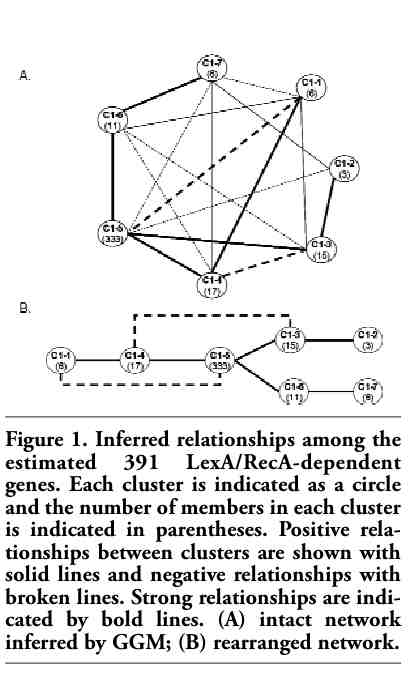 |
Figure 1. Inferred relationships among the estimated 391 LexA/RecA-dependent genes. Each cluster is indicated as a circle and the number of members in each cluster is indicated in parentheses. Positive relationships between clusters are shown with solid lines and negative relationships with broken lines. Strong relationships are indicated by bold lines. (A) intact network inferred by GGM; (B) rearranged network. |
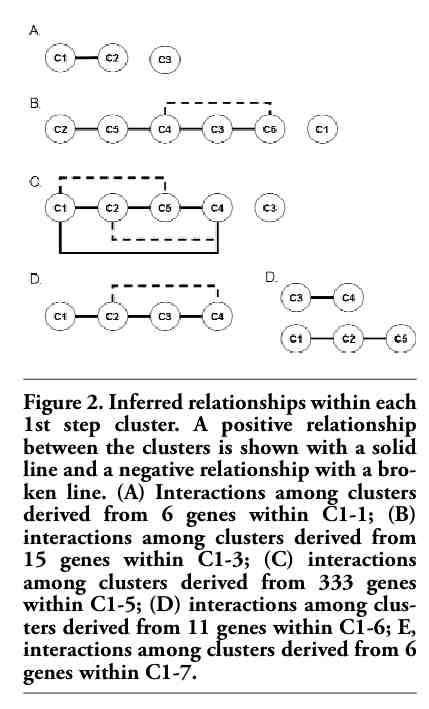 |
Figure 2. Inferred relationships within each 1st step cluster. A positive relationship between the clusters is shown with a solid line and a negative relationship with a broken line. (A) Interactions among clusters derived from 6 genes within C1-1; (B) interactions among clusters derived from 15 genes within C1-3; (C) interactions among clusters derived from 333 genes within C1-5; (D) interactions among clusters derived from 11 genes within C1-6; E, interactions among clusters derived from 6 genes within C1-7. |
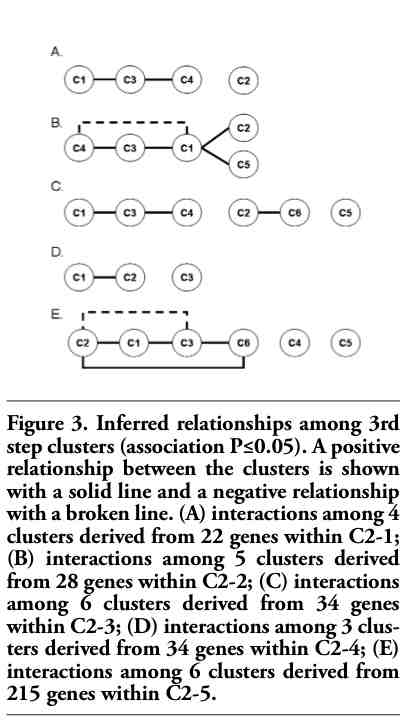 |
Figure 3. Inferred relationships among 3rd step clusters (association P≤0.05). A positive relationship between the clusters is shown with a solid line and a negative relationship with a broken line. (A) interactions among 4 clusters derived from 22 genes within C2-1; (B) interactions among 5 clusters derived from 28 genes within C2-2; (C) interactions among 6 clusters derived from 34 genes within C2-3; (D) interactions among 3 clusters derived from 34 genes within C2-4; (E) interactions among 6 clusters derived from 215 genes within C2-5. |
GGM provides insight into the expression of LexA regulatory genes implicated in the SOS response. A stepwise hierarchical clustering revealed interactions within larger clusters of genes derived from earlier stages of the model. As such, stepwise GGM may indicate interactions between genes on a finer scale.
In this study, I applied two statistical approaches to estimate LexA/RecA-dependent manner genes from E. coli. The expression levels were measured in four conditions, but comparison of expression patterns between only two conditions, wild type strain with UV or the other conditions, is suitable for estimating the LexA/RecA-dependent genes. In previous studies, 535 genes were detected by a four-way comparison as WT with UV treatment-specific genes.25 Although 62 LexA/RecA-dependent genes were detected among 535 detected genes in the previous study, the number of known LexA-regulated genes detected in the present study was higher. As such, stepwise analysis may detect higher numbers of LexA-regulated genes than other methods, such as visual inspection or four-way comparison.8,25
A limitation of this approach is that the biological function of genes remains unknown. Further, the derived networks are presented as undirected graphs, so the order of gene expression in the SOS response is also unknown. However, the inferred positive and negative associations between clusters appear to reflect the sequence of the SOS response, which includes the circuit or feedback mechanism.3,4 Although part of the SOS response has been described,2,4,5 the relationship among different LexA/RecA-dependent genes is still unresolved. Stepwise modeling presented here provides insight into the regulatory networks implicated in the SOS response.
1. Friedberg EG, Graham CW, Siede W. DNA Repair and Mutagenesis. Washington DC: ASM press, 1995.
2. Koch WH, Woodgate R. The SOS response. In: DNA Damage and Repair: DNA Repair in Prokaryotes and Lower Eukaryotes. Totowa NJ: Humana Press, 1998, 107-34.
3. Brent R, Ptashne M. Mechanism of action of the LexA gene product. Proc Natl Acad Sci USA 1981;78:4204-8.[PubMed]
4. Little JW, Mount DW. The SOS regulatory system of E.coli. Cell 1982;29:11-12. [Abstract]
5. Little JW, Mount DW, Yanisch-Perron CR. Purified lexA proteins is a repressor of the recA and lexA genes. Proc Natl Acad Sci USA 1981;78:4199-203. [PubMed]
6. Fernandez de Henesrosa AR, Ogi T, Aoyagi S, et al. Identification of additional genes belonging to the LexA regulon in Escherichia coli. Mol Microbiol 2000;35: 1560-72. [PubMed]
7. Lewis LK, Harlow GR, Gregg-Jolly LA, Mount DW. Identification of high affinity binding sites for LexA which define new DNA damage-inducible genes in Escherichia coli. J Mol Biol 1994;241:507-23. [PubMed]
8. Courcelle J, Khodursky A, Peter B, et al. Comparative Gene expression profiles following UV exposure in wild-type and SOS-deficient Escherichia coli. Genetics 2001;158: 41-64. [PubMed]
9. Akutsu T, Miyano S, Kuhara S. Algorithms for identifying Boolean networks and related biological networks based on matrix multiplication and fingerprint function. J Comput Biol 2000;7:331-43. [PubMed]
10. Friedman N, Linial M, Nachman I, Pe’er D. Using Bayesian networks to analyze expression data. J Comput Biol 2000;7: 601-20. [PubMed]
11. Tavazoie S, Hughers JD, Campbell MJ, et al. Systematic determination of genetic network architecture. Nat Genet 1999;22: 281-5. [PubMed]
12. Aburatani S, Horimoto K. Elucidation of the relationships between LexA-regulated genes in the SOS response. Genome Informatics 2005;16:95-105. [PubMed]
13. Mann HB, Whitney DR. On a test of whether one of two random variables is stochastically larger than the other. Ann Math Stat 1947;18:50-60.
14. Wilcoxon, F. Probability tables for individual comparisons by ranking methods. Biometrics 1947;3:119-22.
15. Edwards D. Introduction to Graphical Modeling. New York: Springer, 1995.
16. Horimoto K, Toh H. Statistical estimation of cluster boundaries in gene expression profile data. Bioinformatics 2001;17:1143-51.[PubMed]
17. Toh H, Horimoto K. Inference of a genetic network by a combined approach of cluster analysis and graphical Gaussian modeling. Bioinformatics 2002;18:287-97. [PubMed]
18. Aburatani S, Kuhara S, Toh H, Horimoto K. Deduction of a gene regulatory relationship framework from gene expression data by the application of graphical Gaussian modeling. Signal Process 2003;83:777-88.[Abstract]
19. Dempster AP. Covariance selection. Biometrics 1972;28:157-75.
20. Wermuth N, Scheidt E. Fitting a covariance selection to a matrix. Algorithm AS 105. Appl Stat 1977;26:88-92.
21. Aburatani S, Goto K, Saito S, et al. ASIAN: a web server for inferring a regulatory network framework from gene expression profiles. Nucl Acid Res 2005;33:W659-64.[PubMed]
22. Aburatani S, Goto K, Saito S, et al. ASIAN: a web site for network inference. Bioinformatics 2001;20:2853-56. [Abstract]
23. Anderson TW. An Introduction to Multivariate Statistical Analysis. 2nd edn. New York: JohnWiley, 1984.
24. Ohmori H, Hatada E, Qiao Y, et al. dinP, a new gene in Escherichia coli, whose product shows similarities to UmuC and its homologues. Mutat Res 1995;347:1-7.[PubMed]
25. Hegde SR, Manimaran P, Mande SC. Dynamic changes in protein functional linkage network revealed by integration with gene expression data. PLos Comput Biol 2008;4:e1000237.[PubMed]
[TOP]